Data Classification using Random Forest classifier
Introduction
When we say classification, what we assume is to group items based on their properties or say characteristics. For example, organizing a list of food as fruits and vegetables or two wheelers and four wheelers. In machine learning, classification is an important aspect for supervised learning. Based on labeled data and learning them, the classifier predicts the input values (classifies them according to its learning). These classifiers are specially designed models used in machine learning for classification tasks.Some of common classifier are Random Forest, decision tree, Support vector machine, linear and logistic regression etc.
Overall project Explanation
Basically, we are going to use random forest classifier to detect Network Anomalies. For this the data are captured from Wireshark application and then exported in csv format for further data manipulation in python. With the sample data set we will create a data frame of selected columns and label encode the string values in integer for ease. Then we split the data into train test and with help of classifier, we will detect network anomaly.
Note: The parameter taken in this project for detecting anomaly may not be enough, but it can provide valuable information.
Note: The parameter taken in this project for detecting anomaly may not be enough, but it can provide valuable information.
Random Forest Classifier
Random forest classifier is one of the classification models in machine learning. Random forest classifier is a classifier which combines multiple decision tree for improving its accuracy of result it provides. The basic working of random forest is such that it provides output based on multiple results of multiple decision tree by taking the majority from result of decision trees or simply by taking average.
Random forest classifier is known for its ability to handle high dimensional data as well handling over fitting problem.
Wireshark
Wireshark is an open-source application use for network analysis. It has variety of use case that includes analyzing network traffics for detecting anomaly by providing detailed information about the packets transmitted over a network. Using Wireshark, we can capture data of packets transmitted over network for time being and them analyze it using different tools. It supports GUI as well. It is commonly used by network administrators, security professions, developers, researchers and students.
Data Collection
Collect data from Wireshark for some time and convert it into csv file for further data manipulation.
Code with Explanation
The packages and the libraries that has been used are:
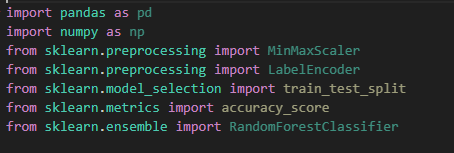
Pandas is used for the data manipulation i.e for loading data, making changes in columns, deriving valuable insights form data etc. NumPy is used for taking absolute value of dataframe columns and creating arrays. Min Max Scaler is used for data standardization. Label Encode is used to convert string data to numeric data. Train test split is used to split the given data into training and testing samples. Accuracy score is used to check accuracy of model and finally Random Forest Classifier is used classify the given data set.

Here, networkdata.csv is loaded using pandas. Then three new dataframes are made i.e packet_size,packet_timing, and protocol and select only necessary data. Label encoding is done for protocol since it is in string format.
normal_protocols = filtered_data['Protocol'].unique()
size_z_score_threshold=3
time_z_score_threshold=3
filtered_data['packet_size_z-score']=(filtered_data['packet_size']-filtered_data['packet_size'].mean())/filtered_data['packet_size'].std()
filtered_data['packet_time_z-score']=(filtered_data['packet_timing']-filtered_data['packet_timing'].mean())/filtered_data['packet_timing'].std()
anomaly_mask = ((np.abs(filtered_data['packet_size_z-score']) > size_z_score_threshold) |
(np.abs(filtered_data['packet_time_z-score']) > time_z_score_threshold)| (~filtered_data['Protocol'].isin(normal_protocols)))
filtered_data['anomaly'] = np.where(anomaly_mask, 1, 0)
Again a column is created i.e anomaly by setting arbitary value of threshold of following and with help of protocols.
size_z_score_threshold=3
time_z_score_threshold=3
Next, data is split into x and y for training and testing purpose. X data is them made standard with MinMaxScaler.
x=filtered_data[['packet_size', 'packet_timing', 'Protocol']]
y=filtered_data['anomaly']
scaler.fit(x)
std_data= scaler.transform(x)
X=std_data
Finally the data is trained after all of the manipulation is done,
X_train, X_test, y_train, y_test = train_test_split(X,y, test_size=0.2, random_state=100)
rf = RandomForestClassifier(n_estimators=100, random_state=42)
rf.fit(X_train, y_train)
Training data is set to be 80% of total data and remaining 20 % is test data. Here we used 100 trees with help of n_estimators parameter.
y_pred = rf.predict(X_test)
accuracy = accuracy_score(y_test, y_pred)
print(f"Accuracy: {accuracy:.2f}")
Now after training is done we can predict the anomaly using test data and accuracy of the prediction is calculated.
Conclusion
Hence, data classification is important aspect of machine learning, more specifically supervised learning. Here the project shows simple classification using Random Forest Classifier example for Network Anomaly Detection with necessary data manipulation.


Comments
Post a Comment